
If you are running a homelab, Docker containers can sometimes crash or become unresponsive. To check on them, we are using five different Linux VMs. Connecting to each one multiple times via SSH is painful. Finding logs takes a long time, and sometimes the logs disappear before you can see them.
Centralized logging fixes this. Instead of hunting for logs across your entire network, your servers and containers send their logs to one central database. Then, you can watch and search everything in one place.In this guide, we will set up a logging stack using three tools: Grafana Loki, Grafana Alloy, and Grafana. Grafana Loki to store the logs, Grafana Alloy to collect them, and Grafana to display them. We will deploy the whole system using Docker Compose on an Ubuntu server and wire up your host machine's syslog.
The Docker Compose Stack
Now we will use Grafana for our homelab logging. For that, we will follow the step-by-step guide below.
Deploying the Grafana Logging Stack
First, we connect to our Ubuntu server using SSH and create a new directory for the stack.
mkdir -p ~/homelab-logging
cd ~/homelab-logging
Then, we will use nano to create a new file called docker-compose.yml and paste the whole block into this file.
nano docker-compose.yml
Paste the whole block into this blank file.
services:
  loki:
    image: grafana/loki:latest
    container_name: loki
    ports:
      - "3100:3100"
    volumes:
      - ./loki-config.yaml:/etc/loki/local-config.yaml
      - loki-data:/loki
    command: -config.file=/etc/loki/local-config.yaml
    restart: unless-stopped

  alloy:
    image: grafana/alloy:latest
    container_name: alloy
    ports:
      - "12345:12345" # Alloy UI
      - "5140:5140/tcp" # Syslog TCP
      - "5140:5140/udp" # Syslog UDP
    volumes:
      - ./config.alloy:/etc/alloy/config.alloy
      - /var/run/docker.sock:/var/run/docker.sock:ro
    command: run --server.http.listen-addr=0.0.0.0:12345 /etc/alloy/config.alloy
    depends_on:
      - loki
    restart: unless-stopped

  grafana:
    image: grafana/grafana:latest
    container_name: grafana
    ports:
      - "3000:3000"
    volumes:
      - grafana-data:/var/lib/grafana
    depends_on:
      - loki
    restart: unless-stopped

volumes:
  loki-data:
  grafana-data:
Configure Loki
We want Loki running in single-binary mode to keep things simple and fast. For that, we create a new file called loki-config.yaml.
nano loki-config.yaml
In this blank file, paste the whole block below.
auth_enabled: false
server:
  http_listen_port: 3100
common:
  path_prefix: /loki
  storage:
    filesystem:
      chunks_directory: /loki/chunks
      rules_directory: /loki/rules
  replication_factor: 1
  ring:
    kvstore:
      store: inmemory
schema_config:
  configs:
    - from: 2020-10-24
      store: tsdb
      object_store: filesystem
      schema: v13
      index:
        prefix: index_
        period: 24h
limits_config:
  reject_old_samples: true
  reject_old_samples_max_age: 168h # Drops logs older than 7 days
Configure Grafana Alloy
Grafana Alloy handles our telemetry and uses a declarative configuration language. We are configuring it to do two things: spin up a listener to catch syslog traffic on port 5140, and automatically hook into our local Docker daemon to scrape container logs. So we create a new file called config.alloy.
nano config.alloy
In this blank file, paste the whole block below.
// 1. Define Loki as the destination
loki.write "default" {
  endpoint {
    url = "http://loki:3100/loki/api/v1/push"
  }
}

// 2. Syslog Listener for Network/VLAN Devices
loki.source.syslog "network_devices" {
  listener {
    address  = "0.0.0.0:5140"
    protocol = "tcp"
  }
  listener {
    address  = "0.0.0.0:5140"
    protocol = "udp"
  }

  forward_to = [loki.relabel.syslog_labels.receiver]
}

// 3. Extract syslog metadata as Loki labels
loki.relabel "syslog_labels" {
  forward_to = [loki.write.default.receiver]

  rule {
    action       = "replace"
    target_label = "job"
    replacement  = "syslog"
  }
  rule {
    source_labels = ["__syslog_message_hostname"]
    target_label  = "hostname"
  }
  rule {
    source_labels = ["__syslog_message_app_name"]
    target_label  = "app"
  }
}

// 4. Scrape Local Docker Containers
discovery.docker "containers" {
  host = "unix:///var/run/docker.sock"
}

// Format Docker container names cleanly
discovery.relabel "docker_logs" {
  targets = discovery.docker.containers.targets

  rule {
    source_labels = ["__meta_docker_container_name"]
    regex         = "/(.*)"
    target_label  = "container"
  }
}

// Push Docker logs to Loki
loki.source.docker "local_docker" {
  host       = "unix:///var/run/docker.sock"
  targets    = discovery.relabel.docker_logs.output
  forward_to = [loki.write.default.receiver]
}
Now spin up the stack:
sudo docker compose up -d
Forward Host Syslog to Alloy
Then, we configure Ubuntu's rsyslog to forward all system logs to Alloy using the RFC5424 format. We create a new config file with the forwarding rule and restart the rsyslog service.
Open the config file:
sudo nano /etc/rsyslog.conf
Scroll to the very bottom and add this exact block at the end of the file:
$ActionSendTCPRebindInterval 256
$WorkDirectory /var/spool/rsyslog
$ActionQueueType LinkedList
$ActionQueueFileName srvrfwd
$ActionQueueMaxDiskSpace 1g
$ActionQueueSaveOnShutdown on
$ActionResumeRetryCount -1
*.* @@127.0.0.1:5140;RSYSLOG_SyslogProtocol23Format
Restart the service to apply the changes:
sudo systemctl restart rsyslog
Querying Your Logs
To view the Grafana interface, paste the command below into your browser.
http://YOUR_SERVER_IP:3000
Replace YOUR_SERVER_IP with your server's IP address and then open the Grafana login page as shown in the image below.
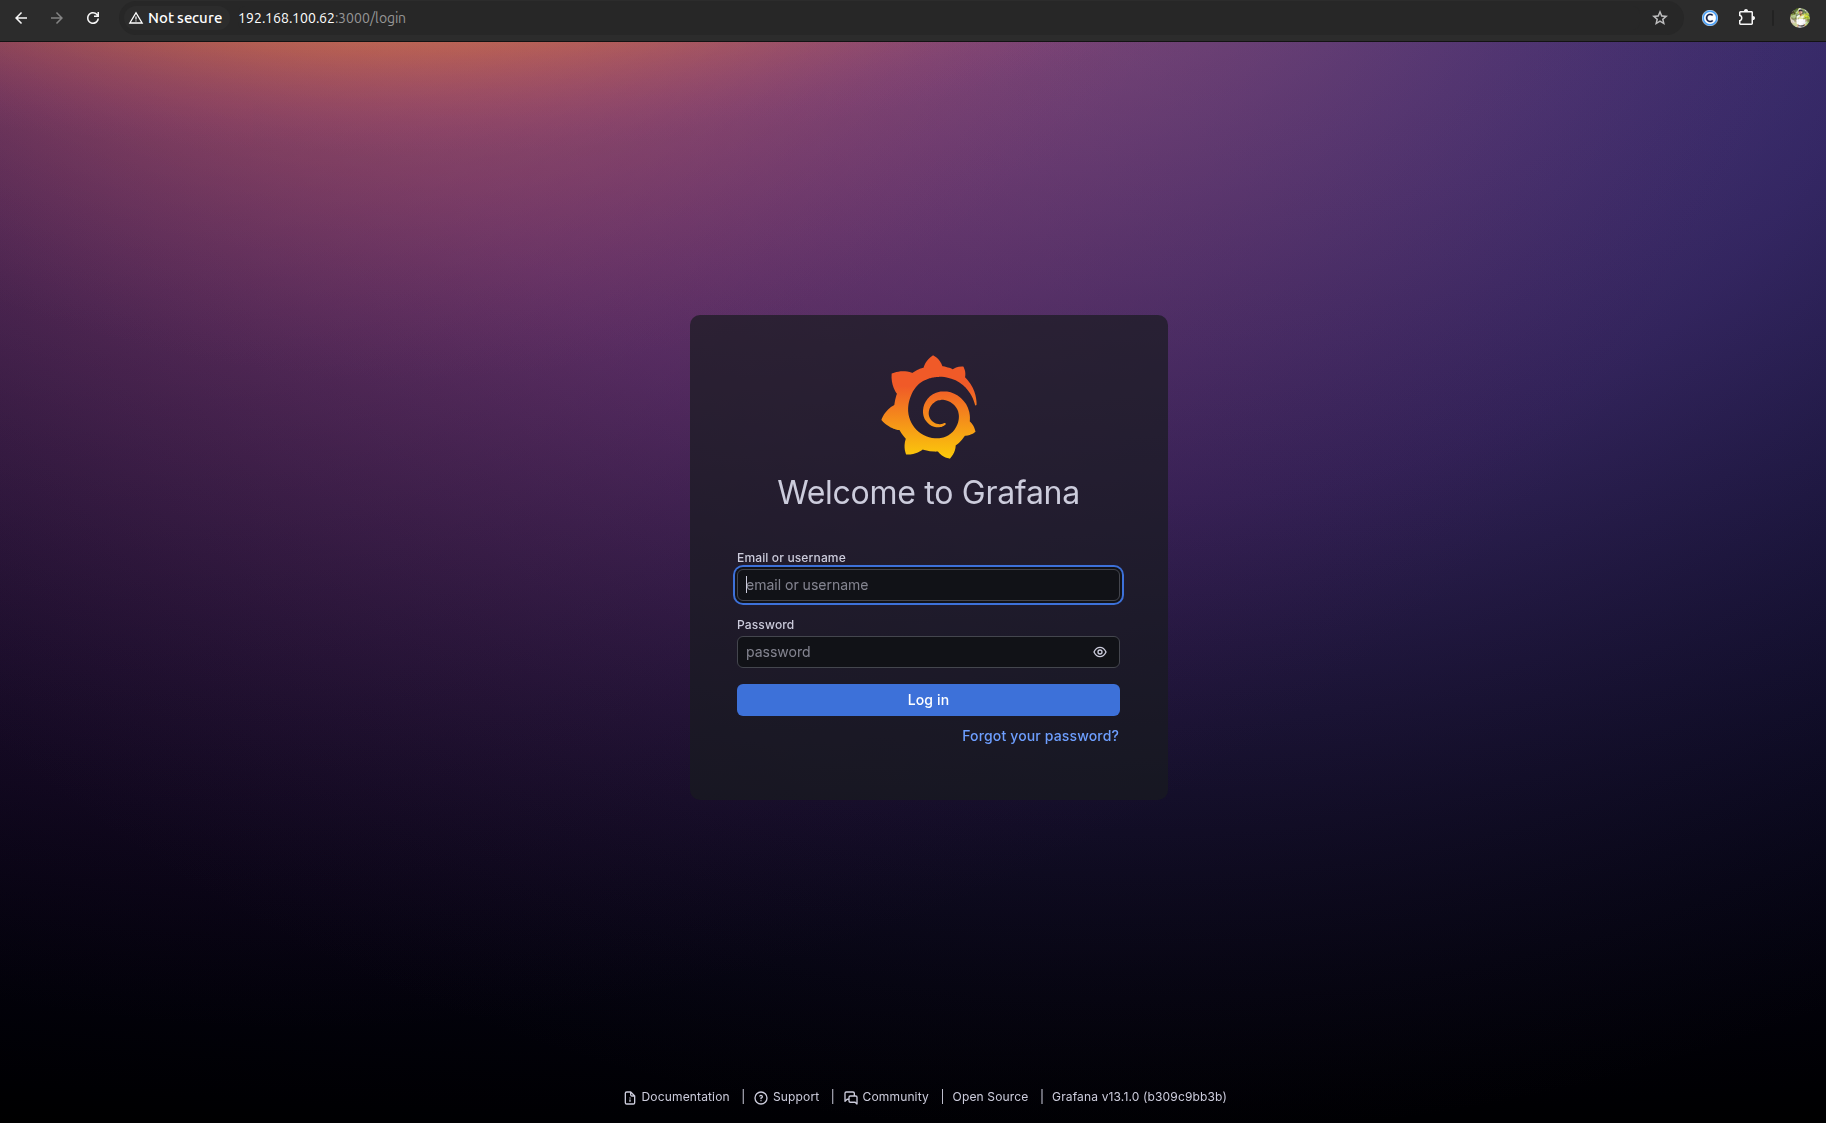
Enter your username and password — the default is admin — and after logging in, you can change your username and password.
Once you are inside Grafana, go to the menu, navigate to Connections, select Data sources, and choose to add Loki as your new data source. Then choose Loki and add it. Next, configure the connection by setting the URL field to http://loki:3100 and clicking the Save & Test button to validate the setup.
Then, proceed directly to the Explore tab to start querying and analyzing your homelab's logs. Loki uses LogQL. It's incredibly fast because we set up our homelab correctly.
To see all your server's system logs (auth, cron, kernel):
{job="syslog"}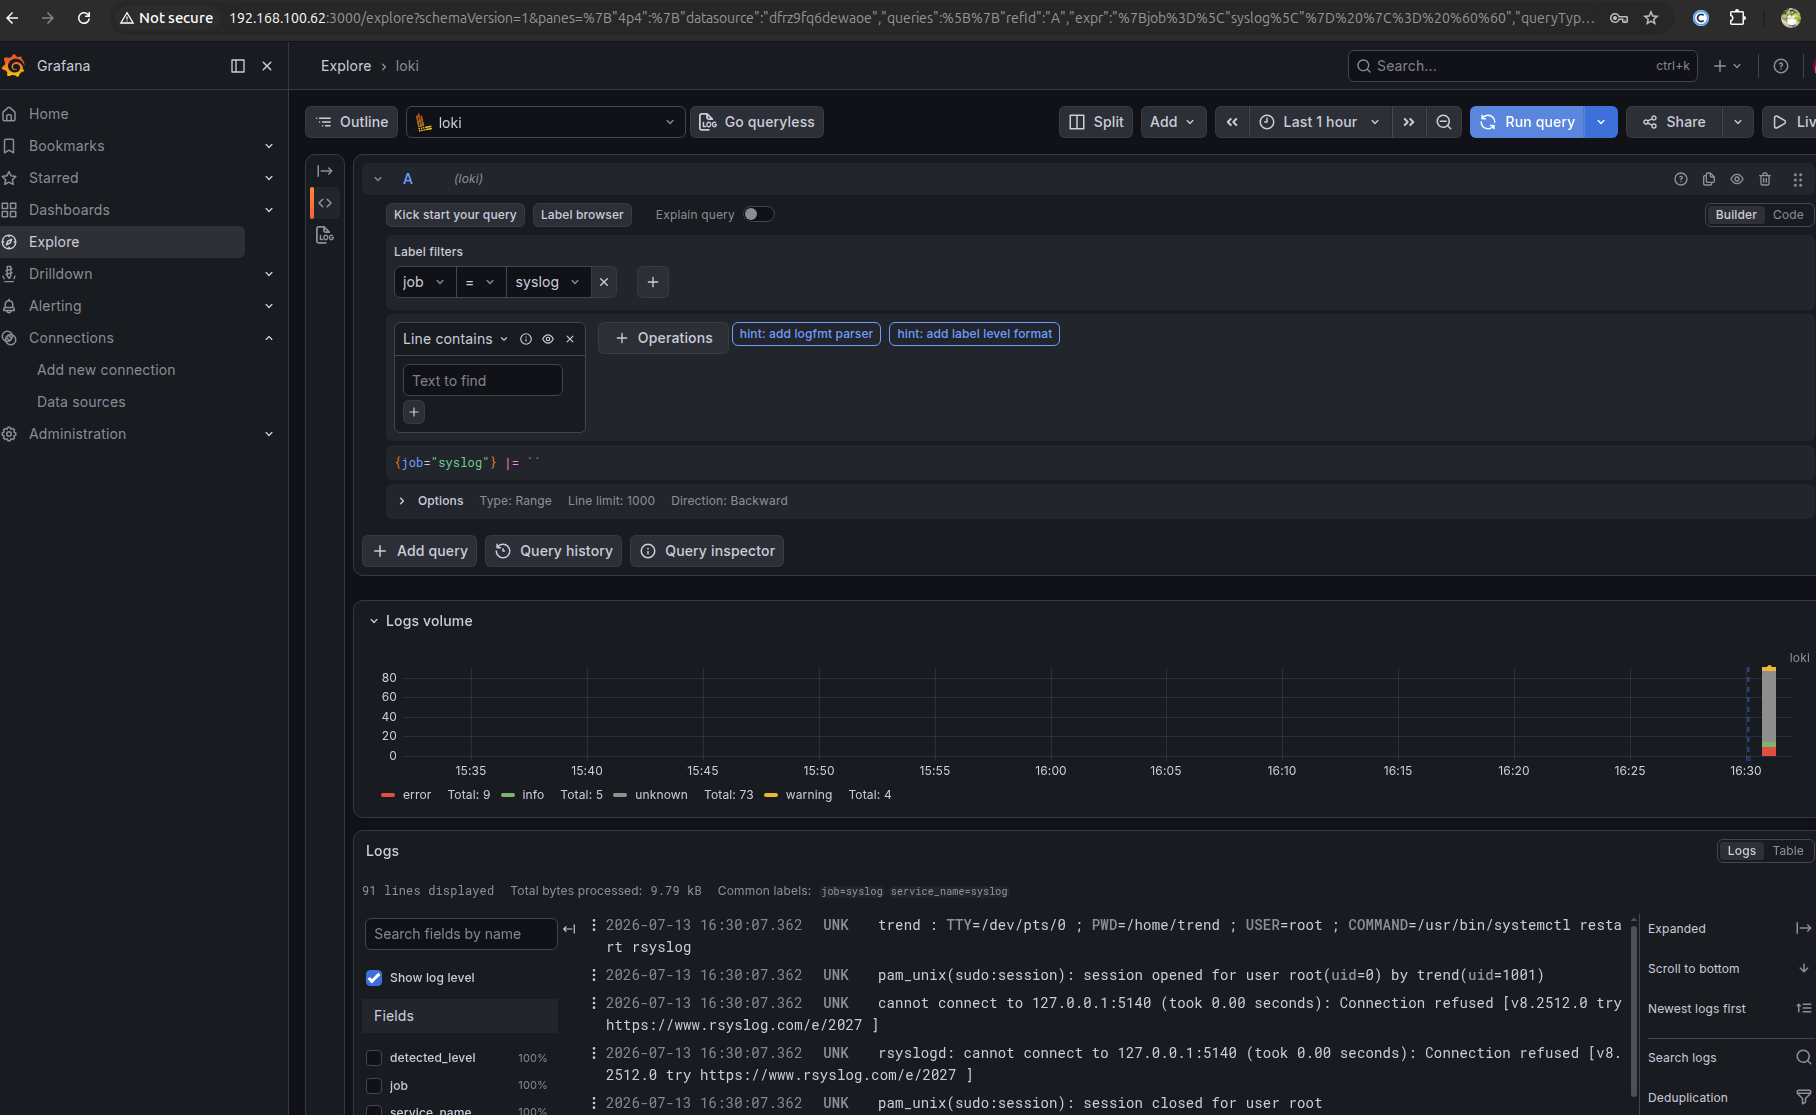
To track down a specific Docker container issue:
{container="alloy"}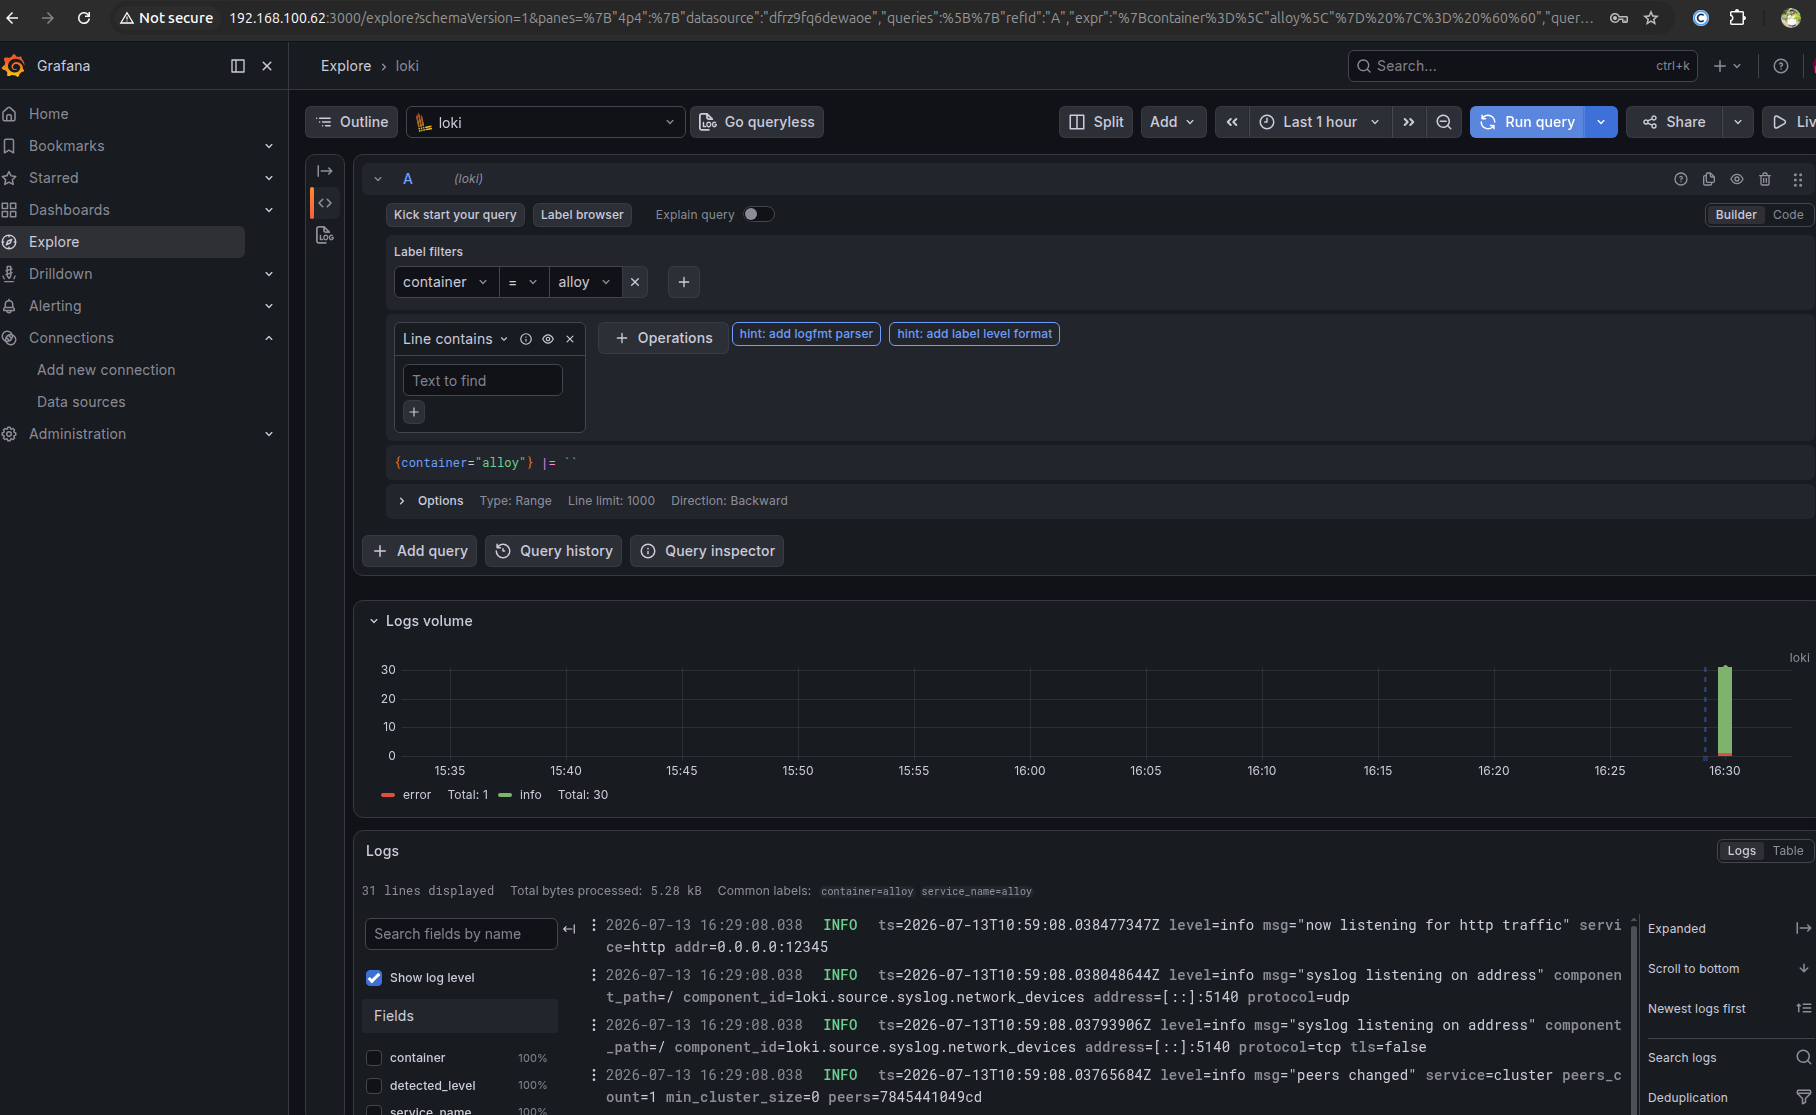
Wrapping Up
Now your homelab is set up so that when you track down a crash, all logs are shown in one place. With Loki, Alloy, and Grafana working together, all your system and container logs stream into a single, highly searchable dashboard. You can set up Grafana alerts to ping you when something breaks in your system. Centralized logging is one of the best upgrades you can make to your homelab.
