
If you're running the Prometheus 3.x train in your homelab or production clusters, then you are also waiting for this one. If you run Prometheus, you know the pain of hardcoding time windows in PromQL. Prometheus 3.14 just dropped on 17th August and it is focused on stability out of the experimental phase. PromQL capabilities finally graduated to stable: duration expressions are now on by default.
I finished testing the 3.14 update out on my own Ubuntu/Proxmox monitoring stack. Here is a deep dive into how Prometheus 3.14 duration expressions fix Grafana downsampling and other annoying quirks of building dashboards.
What Are Duration Expressions?
Until now, PromQL required specific time periods. If you wanted a 5-minute rate, then you needed to write [5m]. If you wanted to offset by an hour, then you needed to write offset 1h.
Now, you can use basic arithmetic (+, -, *, /, %, ^) anywhere a time duration is expected. This includes range vector selectors and offset modifiers.
# Basic math in a range vector (results in a 10-minute range)
rate(node_cpu_seconds_total[5m * 2])

# Basic math in an offset
node_memory_MemAvailable_bytes offset (1h / 2)
Expected Output:
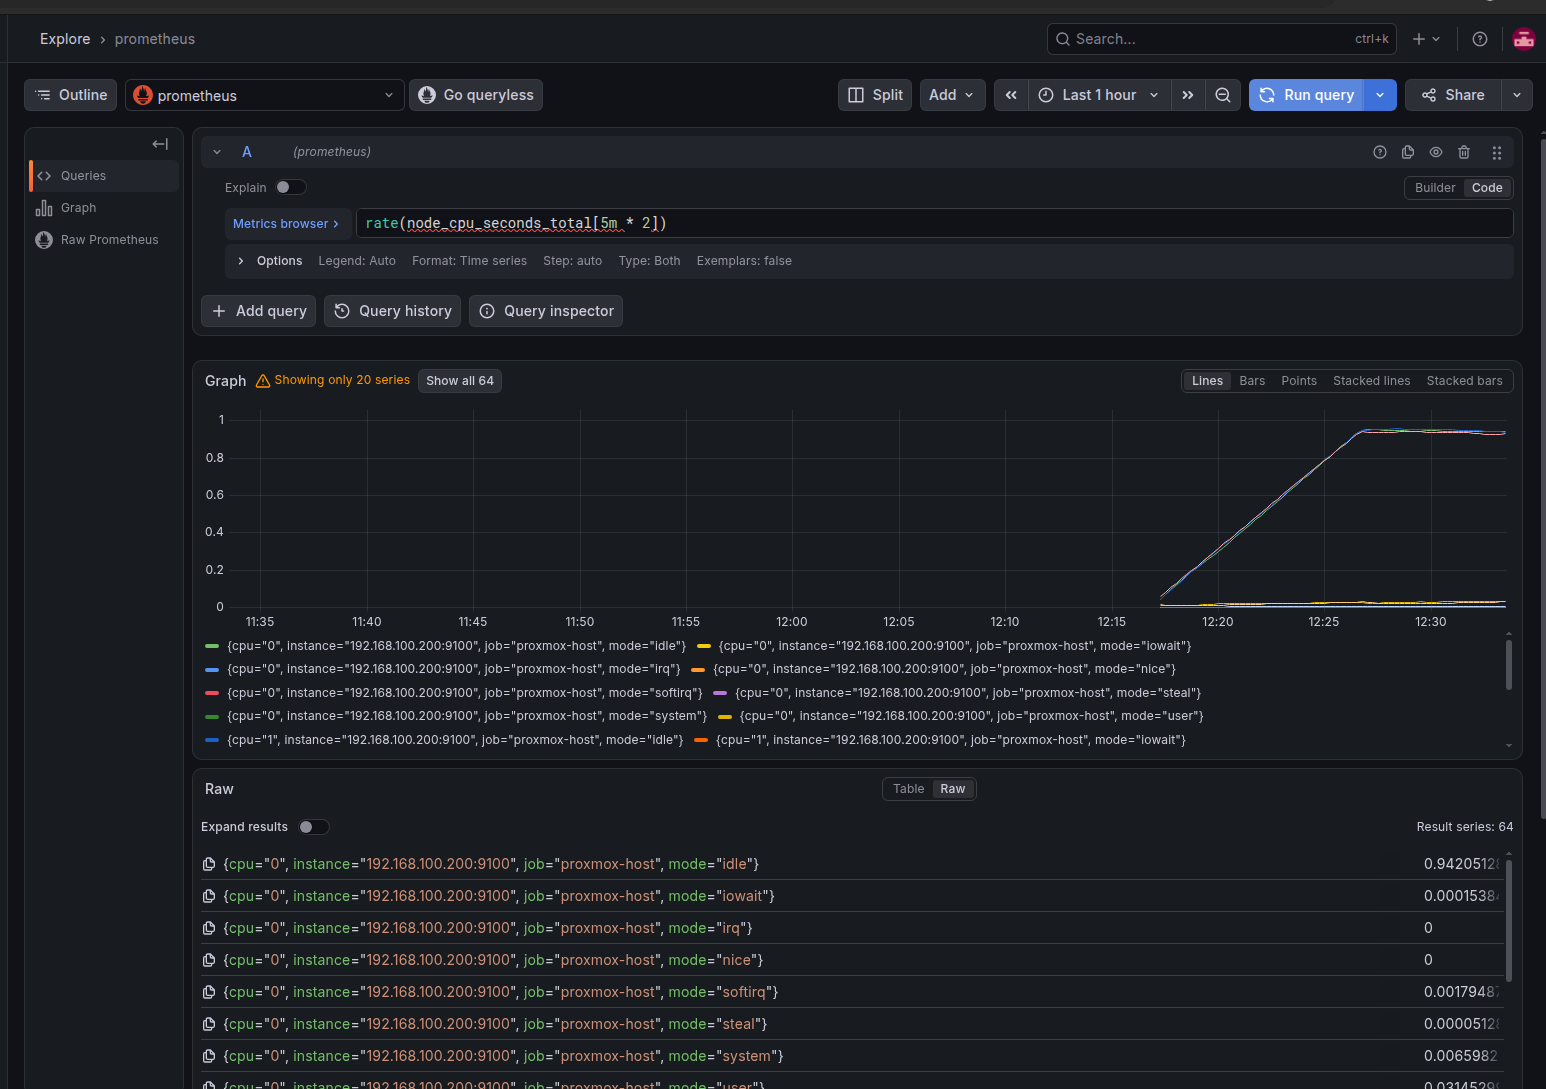
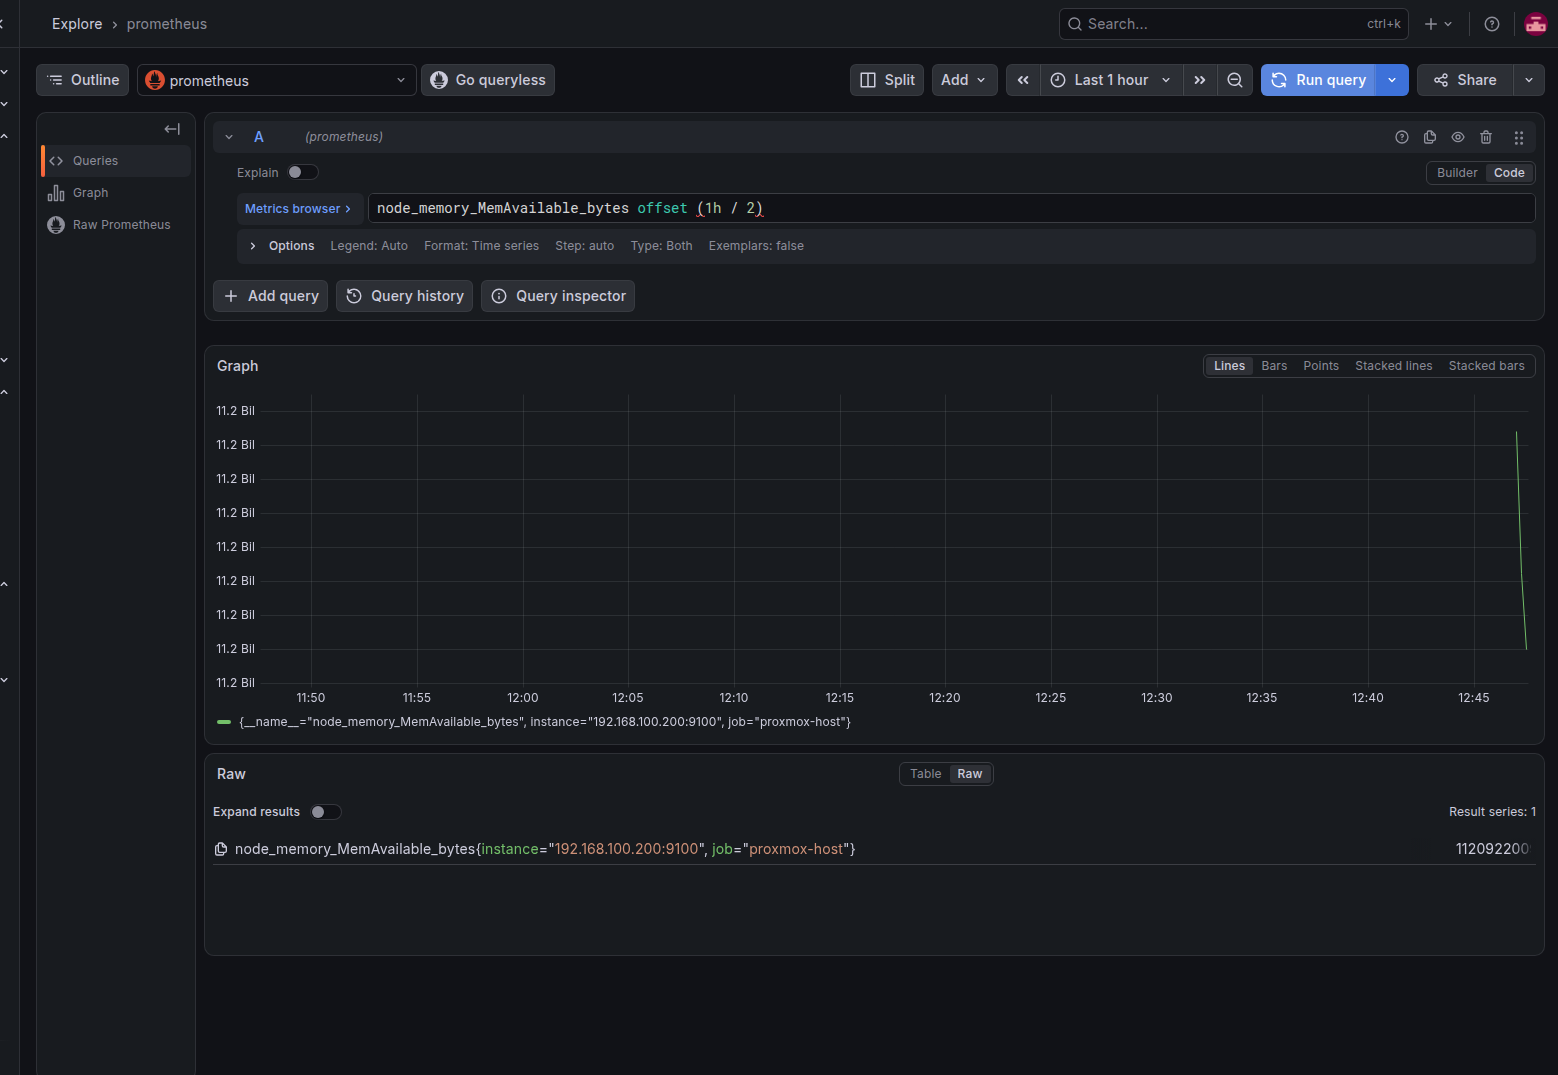
One quick note on the offset: When using offset with a duration expression, you need to wrap the expression in parentheses. If you don't, Prometheus will only read the first value.
Fixing the Grafana zoom problem
Basic math is fine, but the actual reason this update matters is fixing Grafana downsampling.
You have probably seen this happen. You write a query like rate(http_requests_total[5m]). When you are viewing the last 3 hours of data, it looks great. But when you zoom out to the last 30 days, Grafana's step size increases to accommodate the wide view. Because your query is stubbornly stuck looking at 5-minute chunks, Prometheus skips data points and your graph turns into inaccurate garbage.
Prometheus 3.14 fixes this by introducing four new functions you can use inside duration brackets:
step(): The time gap between data points on your graph. If Grafana is pulling a new data point every 30 seconds, step() becomes 30s. If you zoom out and Grafana starts pulling data every 2 hours, step() becomes 2h.
range(): The total time window you are looking at right now. If your dashboard is set to "Last 7 days", range() is 7 days.
min_of(): Looks at two times and picks the shorter one.
max_of(): Looks at two times and picks the longer one.
By combining max_of() with step(), you can tell Prometheus to use your 5-minute window by default, and dynamically expand it if Grafana zooms out further than 5 minutes.
# Dynamically adapts to Grafana's zoom level
rate(node_cpu_seconds_total[max_of(step(), 5m)])
No more broken graphs when you zoom out.
Looking Back Over the Entire Range
Another great use case is calculating stats over the exact time window you are currently viewing. You can now pass range() to grab the dashboard's total time window and pin it to the right edge of the graph using @ end().
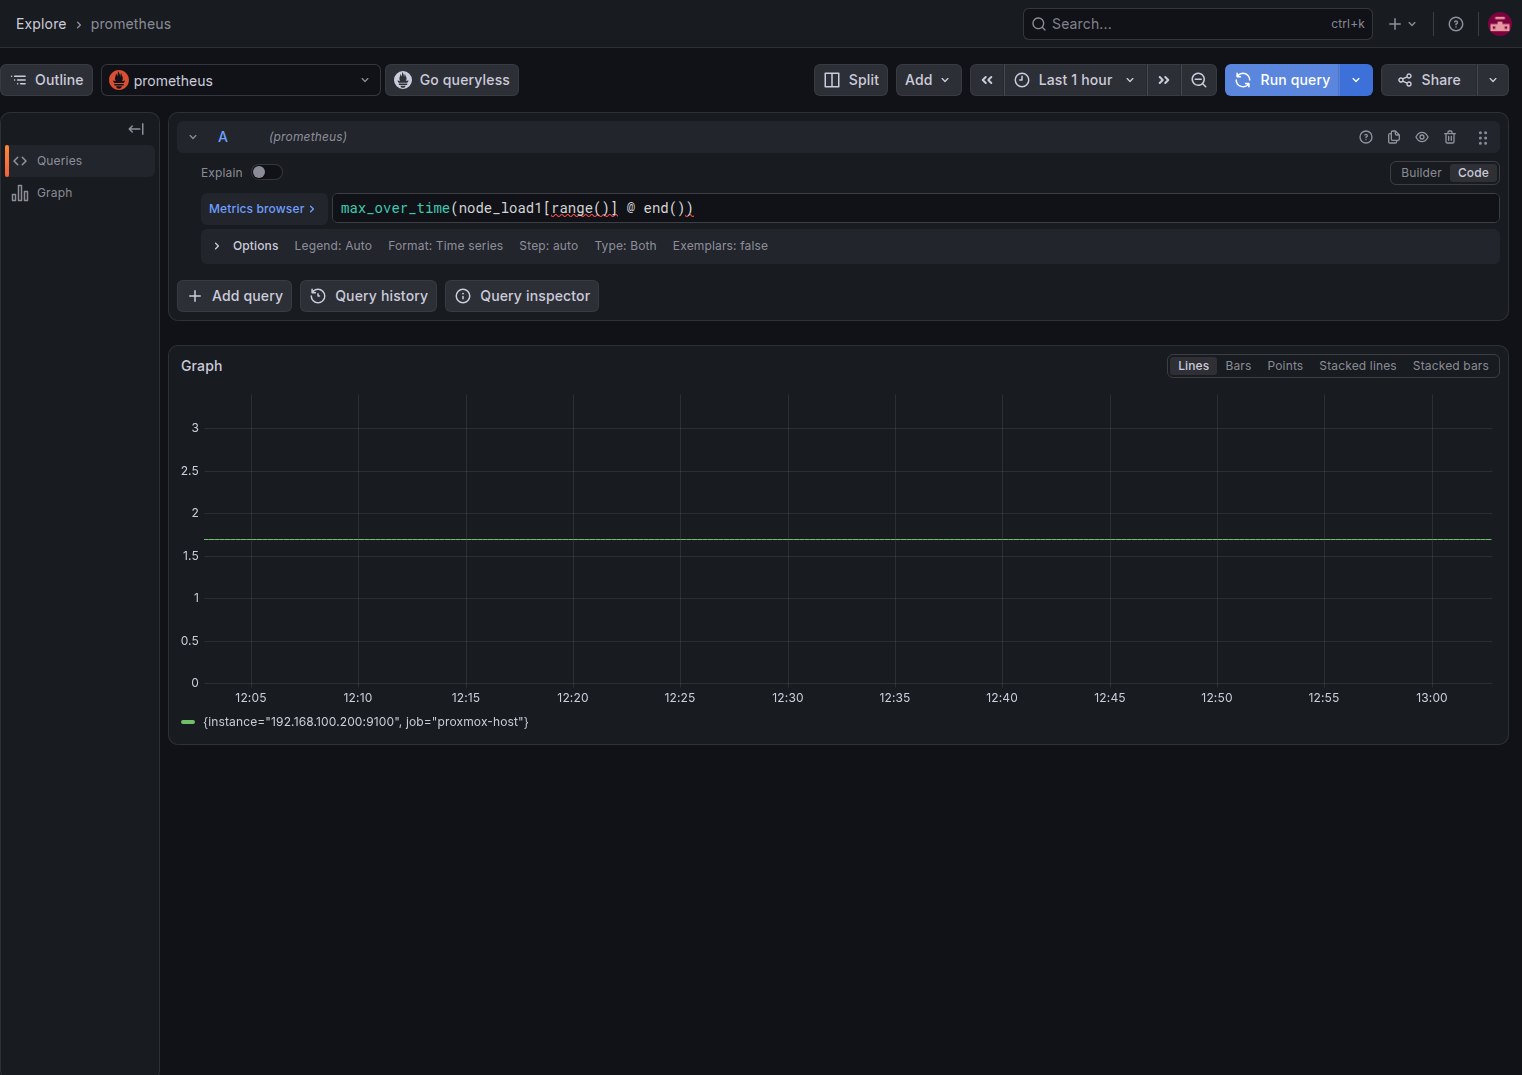
If you want to draw a flat line across your graph showing the absolute peak server load, run the query below.
# Finds the maximum load across the current Grafana view
max_over_time(node_load1[range()] @ end())
Expected Output:
If you have been passing --enable-feature=promql-experimental-functions to your Docker Compose or systemd files just to use these features, you can finally clean up your configs. Strip the flag, pull the v3.14.0 image, and enjoy dynamic time queries out of the box.
