
When we build a homelab, our first requirement is how to monitor our server. Whenever our system goes down, Uptime Kuma tells you it's down and Beszel tells you your RAM is pegged. But we need to pinpoint the exact cause. Netdata is the specific tool that lets you see which individual background process is overloading your hard drives or why your server went down at midnight.
In the modern day, there are too many newer and lightweight dashboards available. Netdata is still a top choice for homelab. Why? Because it automatically tracks system data every single second without needing any manual setup. You can install it simply and easily. It provides the best dashboard showing how your system is performing.
Here is how to get it running on your Ubuntu 24.04 server and how to bypass the cloud login screen.
Netdata Installation
Netdata's biggest selling point is how fast you can deploy it. For installation, SSH into your Ubuntu 24.04 server.
Before any installation, we need to keep our system up to date. For that, run the below command in your terminal.
sudo apt update && sudo apt upgrade -y
Now we install Netdata. For that, run this to download and execute the official kickstart script.
wget -O /tmp/netdata-kickstart.sh https://get.netdata.cloud/kickstart.sh
sudo sh /tmp/netdata-kickstart.sh --stable-channel
The script will automatically detect your OS, install the necessary dependencies, and start the service.
Once the installer finishes, open the default port if you're using UFW:
sudo ufw allow 19999/tcp
Once the installation is complete, you would normally navigate to
http://YOUR_SERVER_IP:19999
Then open the page like the image below.
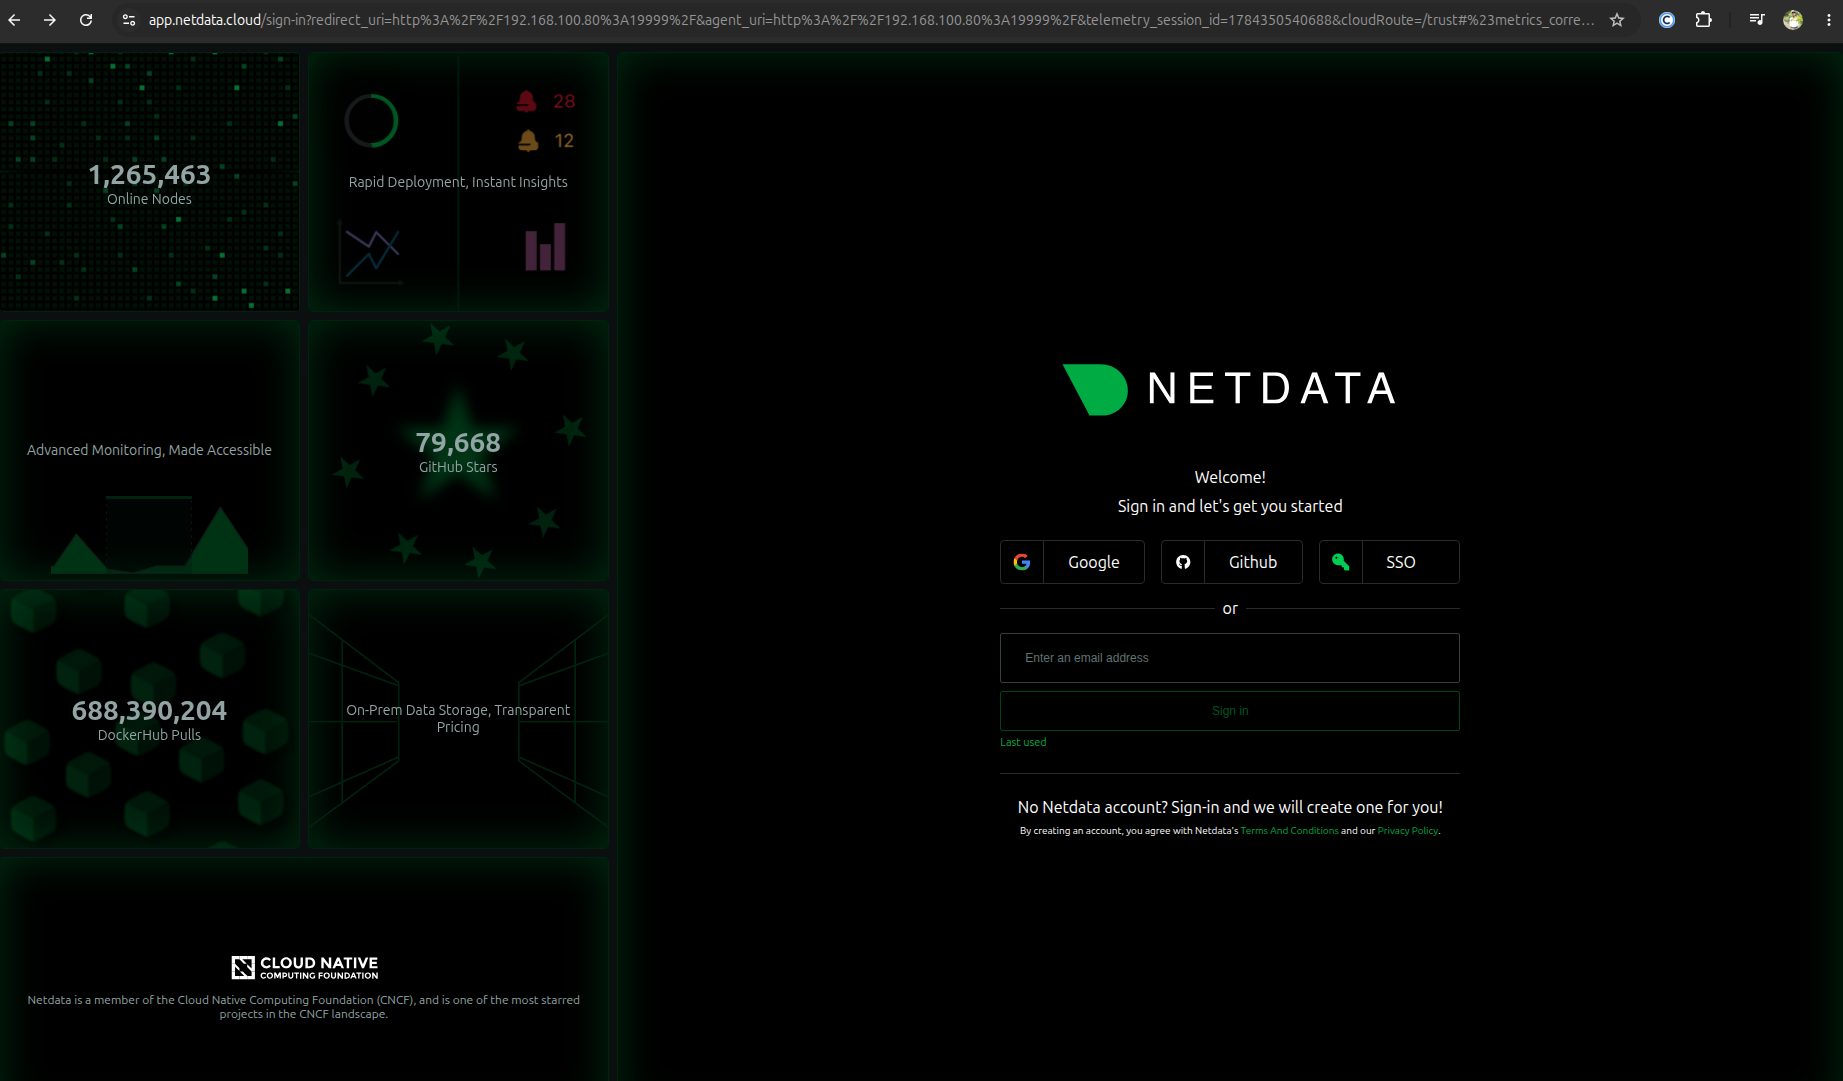
If you are installing for the first time, then you will likely face this situation. Here you are required to have a Google account or GitHub account. But if you don't have these accounts and want to log in without an account and open your dashboard, then follow this method.
Simply add /v3/ to the end of your URL to force the local dashboard:
http://YOUR_SERVER_IP:19999/v3/
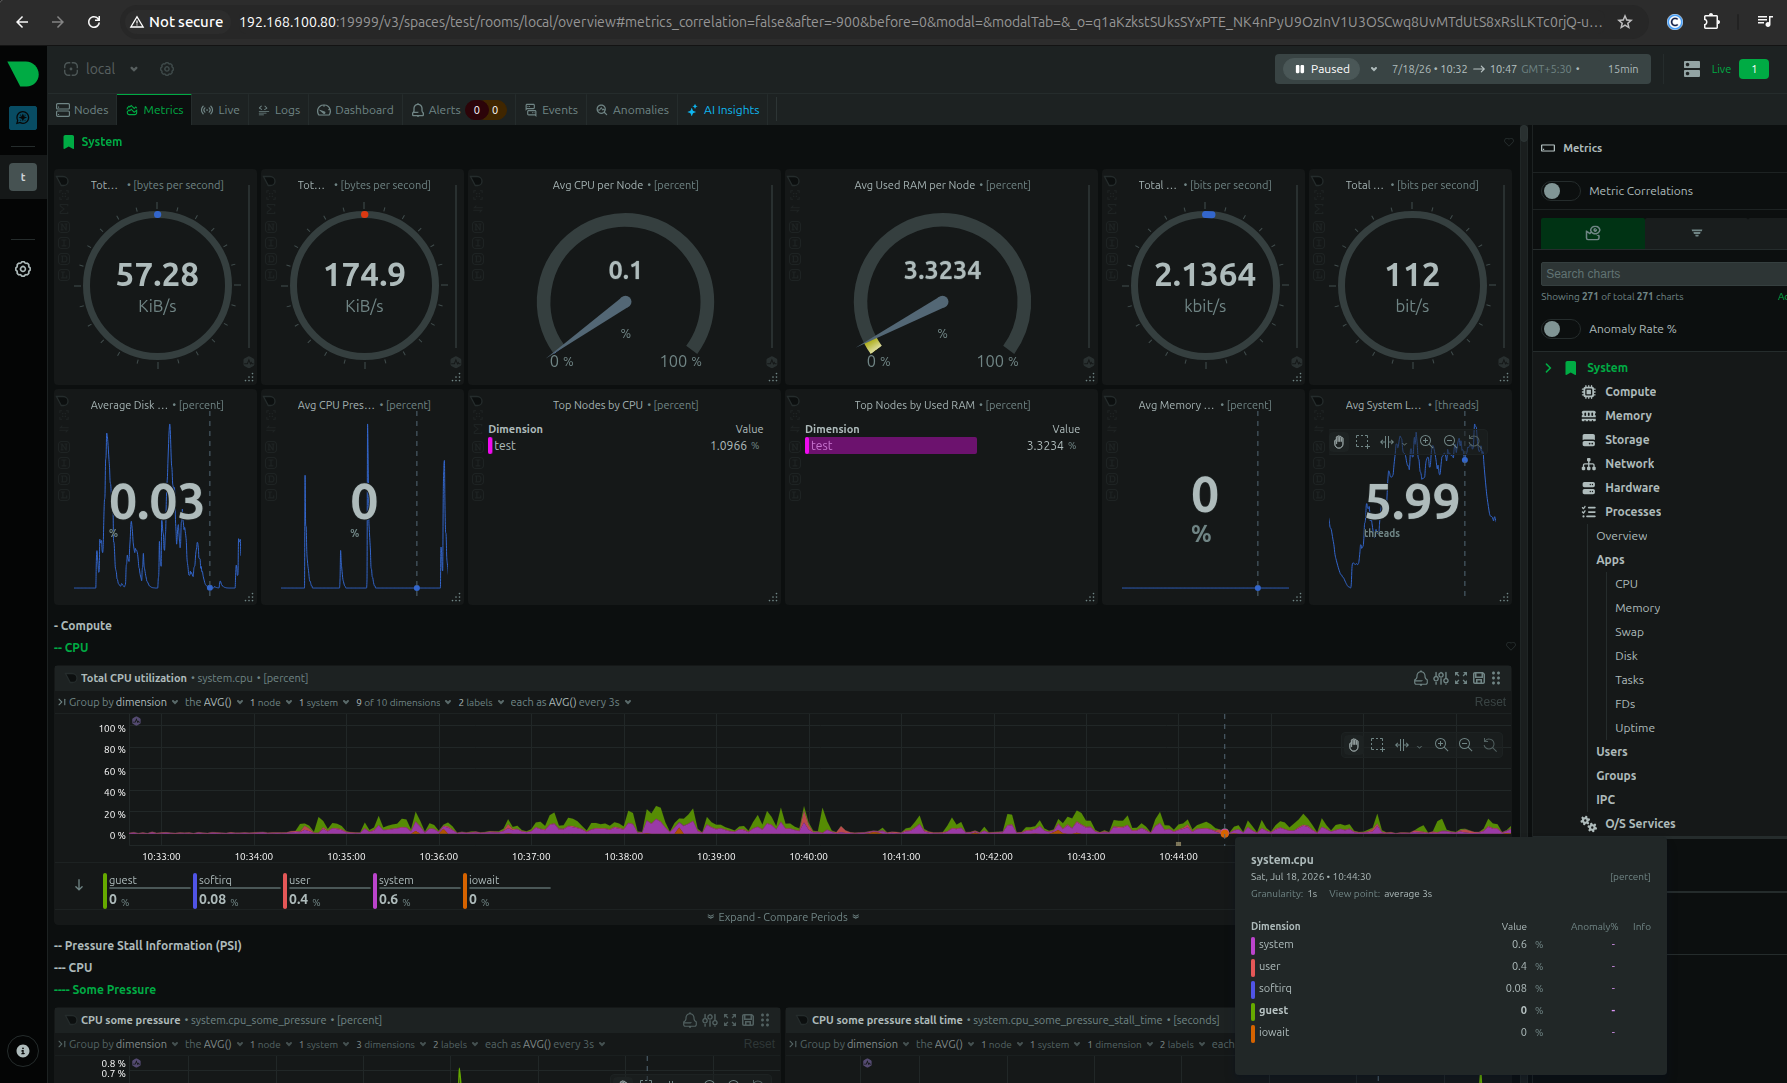
Then open your dashboard without requiring any account, as shown in the image below.
Usage of Netdata
Netdata is primarily used to watch your infrastructure in real time and fix problems the second they happen. It automatically monitors your servers, containers, and apps without requiring any setup. It gives you the best dashboard with full CPU, RAM, and disk monitoring.
Drawbacks of Netdata
I have personally used Netdata. For micro-monitoring, this tool is best for you. If you have five or fewer nodes, it works best and is free. When the number of nodes in your homelab increases beyond five, you need to pay $4.50/node/month. This is not ideal for your homelab setup, or if you are a researcher who needs a free, self-hosted, open-source tool where all control is in your own hands.
This tool connects with the cloud, so some control is not in your hands. But if you have a few nodes and need the best monitoring, then this tool is the best.
Conclusion
While tools like Uptime Kuma and Beszel are fantastic for high-level alerts, Netdata is still the best for a deep dive into troubleshooting. When you create more than five nodes, you need to pay, which is frustrating for the self-hosting community. However, by using the local dashboard bypass, you keep full control of your data without paying enterprise fees. If you want a zero-configuration microscope that tells you exactly what your server is doing every single second, Netdata is still a must-have in your homelab stack.
