
Modern IT systems are complex. Observability is now a necessity. You must watch your system closely. You need to fix microservices. You must monitor server health. You need to analyze logs. A central log system is critical. For that, you need ELK Stack. The ELK Stack can help you. ELK means Elasticsearch, Logstash, and Kibana. It is open-source software. It is the standard industry tool. It manages and analyzes your logs.
Setting up ELK used to be easy. Elastic released version 8.x. This version changed the setup. Security is now turned on automatically. Elasticsearch now enables HTTPS by default. It generates security certificates. It requires user passwords immediately. Your system is secure on day one. However, the installation process is different. Old setup guides do not work now. They will cause security errors. They will show unauthorized access messages. This guide works for version 8.x. It is tested and complete. It helps you install the secure stack. This installation works on Ubuntu and Debian systems.
Here is the definitive, fully tested guide to installing and configuring a secure Elastic Stack 8.x on Ubuntu/Debian environments.
Prerequisites
Before we begin, make sure your server is ready: An Ubuntu 24.04 or 26.04 or Debian machine with at least 4 GB RAM and 2 CPUs. The user must have sudo privileges.
Update and Upgrade
In any Linux distribution, if you want to install any packages, your system must be up-to-date. So update and upgrade your system using the below command.
sudo apt update
sudo apt upgrade -y
Add the Official Elastic Repository
Ubuntu does not include Elasticsearch by default. Its standard software repositories lack these files. We must update the system source list. We must add the official Elastic repository. This tells Ubuntu where to find the packages. It ensures you get the correct software.
Install prerequisites and download the Elastic GPG Key:
This ensures you are downloading authentic, tamper-proof software. To download the Elastic GPG key, use the below command.
sudo apt-get install apt-transport-https -y
wget -qO - https://artifacts.elastic.co/GPG-KEY-elasticsearch | sudo gpg --dearmor -o /usr/share/keyrings/elasticsearch-keyring.gpg
Add the Elastic 8.x repository to your system:
echo "deb [signed-by=/usr/share/keyrings/elasticsearch-keyring.gpg] https://artifacts.elastic.co/packages/8.x/apt stable main" | sudo tee /etc/apt/sources.list.d/elastic-8.x.list
Update your package lists:
After downloading the Elastic GPG key and adding the Elastic repository, update your system using the below command.
sudo apt update
Install and Secure Elasticsearch
Elasticsearch is the core data engine of the stack. For that, follow the below method.
Install the package:
sudo apt install elasticsearch -y
Start and enable the service:
sudo systemctl daemon-reload
sudo systemctl enable elasticsearch
sudo systemctl start elasticsearch
Reset the default user password:
Elasticsearch creates a random password during installation. Users often miss this text in the terminal. You should create a new password now. This password is for the main admin user. The admin username is elastic. Run the command to reset the password.
sudo /usr/share/elasticsearch/bin/elasticsearch-reset-password -u elastic
Press y to confirm. The terminal will display a new password. Save this password in a secure place. When you log in to the ELK Stack home page, this password will be required. This password will appear as shown in the image below on your terminal.

Test your secure connection:
You must test your new secure connection. Version 8.x uses HTTPS by default now. A standard HTTP curl command will fail. You must use HTTPS in your command.
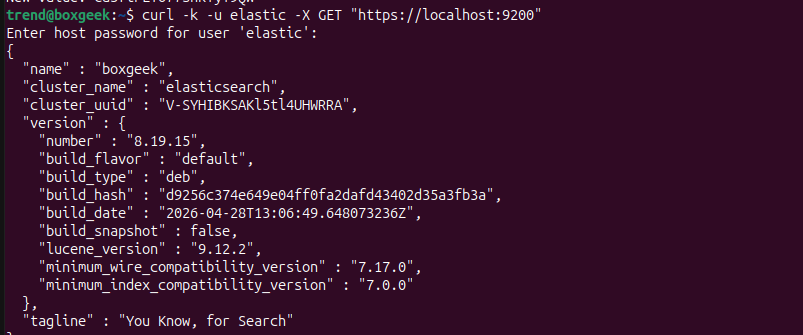
curl -k -u elastic -X GET "https://localhost:9200"
When you enter the above command, you will be asked for the elastic password that you saved earlier. It will then show you text like the image below. When you see text like the image below on your command line, your database is working perfectly.
Install and Configure Kibana
Kibana is the beautiful web interface we use to visualize our data.
Install Kibana:
sudo apt install kibana -y
Allow remote access to the dashboard:
Kibana blocks outside network connections by default. It only allows access from the local machine. You must change settings for remote access. This lets you use your personal browser. Open the configuration file with nano.
sudo nano /etc/kibana/kibana.yml
In this file, search for the line #server.host: "localhost". Remove the # symbol from the start. Change the word localhost to "0.0.0.0". This opens access to all network computers. In this file, remove localhost and # and write as shown below.
server.host: "0.0.0.0"
After updating the file, enable and start Kibana.
Start the Kibana service:
sudo systemctl daemon-reload
sudo systemctl enable kibana
sudo systemctl start kibana
The Secure Pairing Process
Elasticsearch is secure. Kibana needs permission to talk to it. You must use enrollment tokens for this. For that, run the command on your server.
Generate a Kibana Enrollment Token:
Run this on your server:
sudo /usr/share/elasticsearch/bin/elasticsearch-create-enrollment-token -s kibana
Expected Output:
eyJ2ZXIiOiI4LjE0LjAiLCJhZHIiOlsiMTkyLjE2OC41MC4xMjU6OTIwMCJdLCJmZ3IiOiI5YmM1Y2Q0MmRhNzZmODIyNzI4YWQwY2ZhYWRjMzlmZjhiZWIzN2M4NGJiYjczMmRmM2FkNjg1MjIwNmY3ZDYxIiwia2V5IjoiRkM3dlQ1NEJ5Yk90UXJpWHVUVXc6bmRqckwzRWJobjdoSlVKckxBMkVVZyJ9
Your terminal will show a long text string as shown above. Copy this entire text string completely. It is required when you log in to the ELK Stack home page at the enrollment token box.
Generate a Verification Code:
Run this command to get a 6-digit code:
sudo /usr/share/kibana/bin/kibana-verification-code
Expected Output:
Your verification code is: 709 308
This output also needs to be copied and saved in a safe place. Note that this verification code changes every 30 minutes.
Login to Elastic
To log in to Elastic, paste the below command into your browser and replace your IP address with your-server-ip.
http://your-server-ip:5601
Then open the home page as shown in the image below.
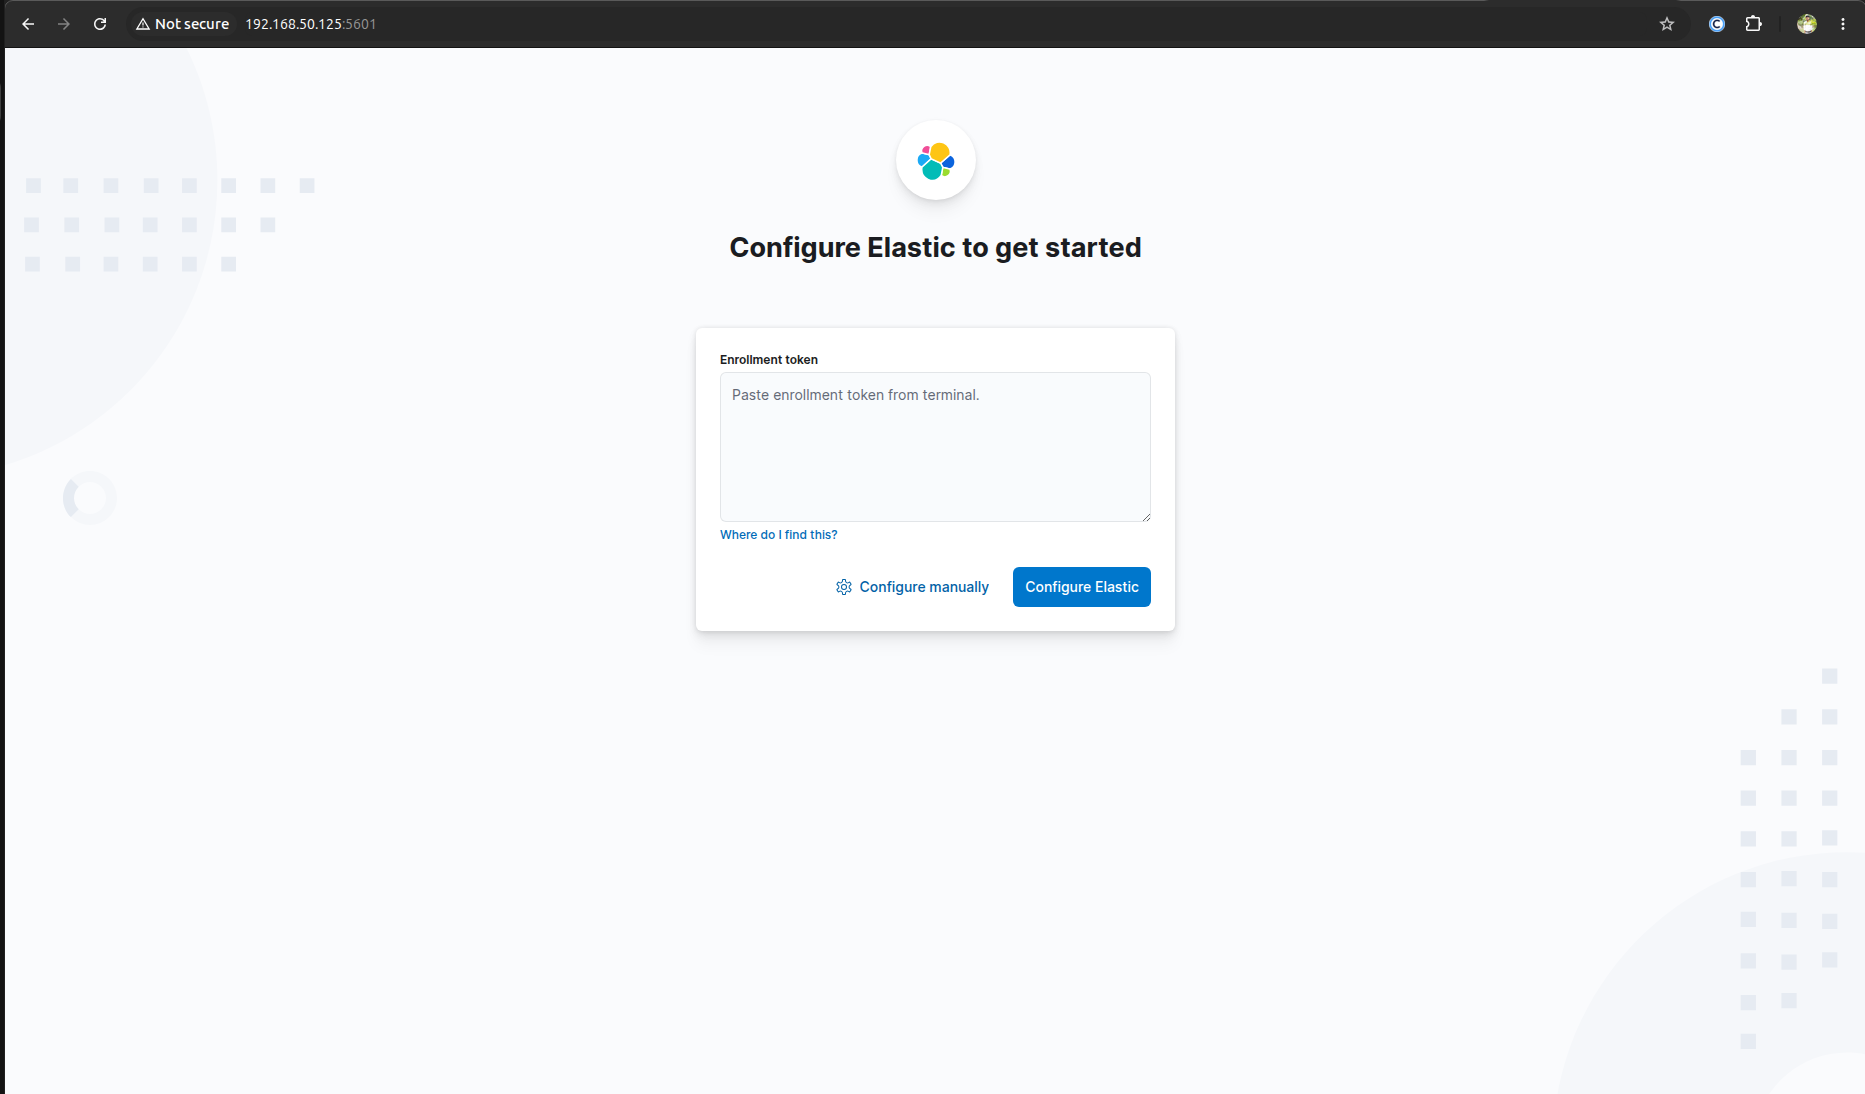
Here, enter the Kibana enrollment token, which is a long text string. You will then be asked for a verification code, so enter your 6-digit code that was previously shown on your command line.
Then the home page will open again, where your username and password are required. Enter your username "elastic" and the password you saved.
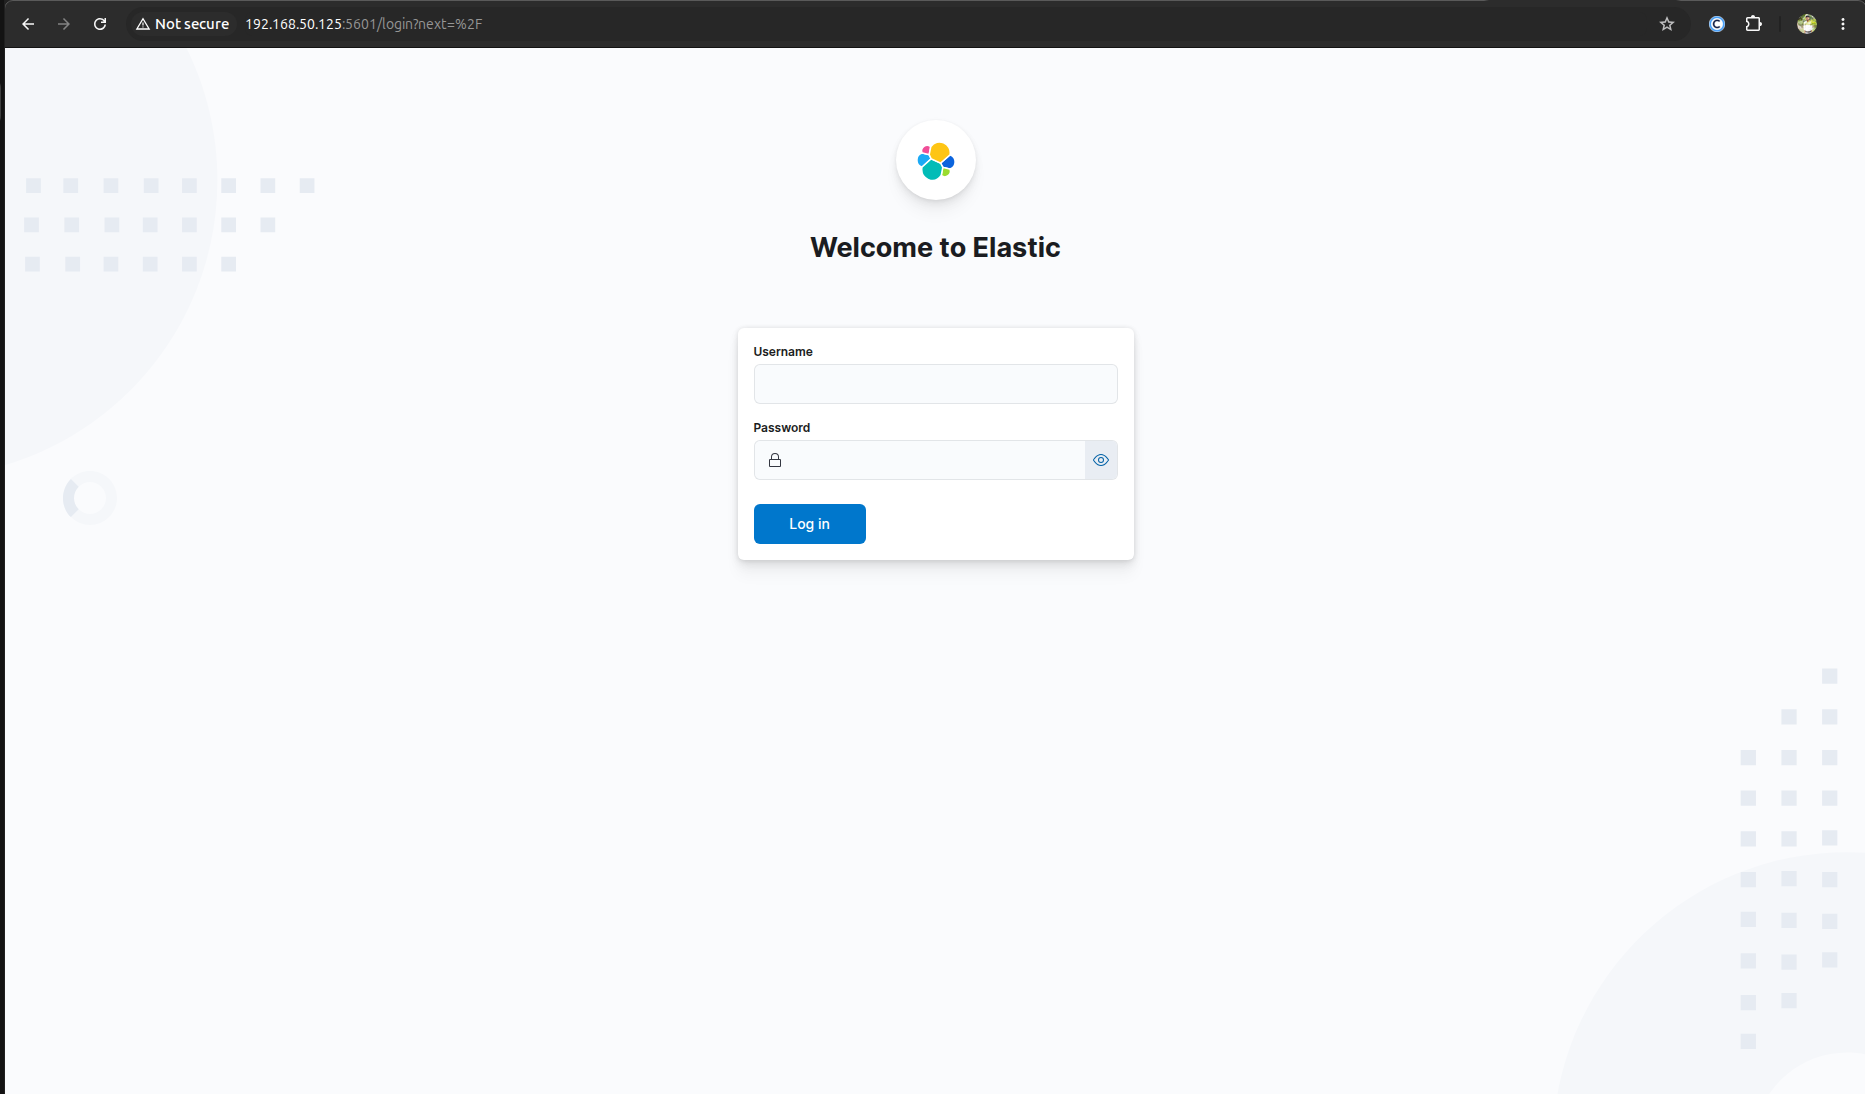
In the next step, click the "Add Integrations" button. Deploy an Elastic Agent to your system. This collects your system metrics automatically. It pulls Nginx logs into your setup. It sends application data to your new cluster.
Conclusion
You finished the setup successfully. You should see the welcome screen now. The screen says "Welcome to Elastic". The system is ready for data integrations. You configured the modern security features correctly. Your Elastic Stack 8.x is fully secure. Your observability system works safely from day one.
