
If you have run Proxmox then you already know the built-in RRD graphs leave a lot to be desired. They are fine for a quick glance to see if there is currently a big problem on any nodes, but they drop data resolution fast. Using this you can easily compare node stats, but it is hard to set up meaningful alerts. So if you want real historical metrics, cross-node comparisons, or actual alerts, you need Prometheus and Grafana.
If you want to install it, I just rebuilt and tested this exact stack from scratch, end-to-end, without 401 or 403 errors. Instead of dumping everything on the hypervisor, we are going to run the monitoring stack on a dedicated Ubuntu 26.04 VM. It keeps the Proxmox host completely clean, isolates your monitoring from your workloads, and makes the whole setup much easier to back up.
Note: We are working with Proxmox and Ubuntu 26.04. I will mention at the start where Proxmox or Ubuntu is required.
On the Ubuntu VM: Base setup
First, create an Ubuntu 26.04 container or virtual machine and open it. Log into your dedicated Ubuntu VM and follow the commands below.
Let's make sure the VM is up to date and grab our base packages. So update and upgrade the Ubuntu server. Then we install Fail2ban, Python, and AppArmor, and then also install Docker Compose.
sudo apt update && sudo apt upgrade -y
sudo apt install ufw fail2ban python3-systemd apparmor -y
sudo apt install docker.io docker-compose-v2 -y
Then lock it down with UFW. Make sure you open SSH before enabling the firewall, or you are going to lock yourself out.
sudo ufw default deny incoming
sudo ufw default allow outgoing
sudo ufw allow ssh
sudo ufw allow 3000/tcp
sudo ufw allow 9090/tcp
sudo ufw enable
On the Proxmox host: Node Exporter
Node Exporter grabs your raw hardware stats. Proxmox does not use sudo, so you are running this as root. I'm using explicit version paths here because using wildcards to clean up the temp files usually ends up deleting the binary before you move it.
cd /tmp
wget https://github.com/prometheus/node_exporter/releases/download/v1.8.0/node_exporter-1.8.0.linux-amd64.tar.gz
tar xvfz node_exporter-1.8.0.linux-amd64.tar.gz
mv node_exporter-1.8.0.linux-amd64/node_exporter /usr/local/bin/
rm -rf /tmp/node_exporter-1.8.0.linux-amd64*

tee /etc/systemd/system/node_exporter.service << 'EOF'
[Unit]
Description=Node Exporter
After=network.target

[Service]
User=root
ExecStart=/usr/local/bin/node_exporter
Restart=on-failure

[Install]
WantedBy=multi-user.target
EOF

systemctl daemon-reload
systemctl enable --now node_exporter
Before moving ahead, make sure the binary is actually there and spitting out metrics.
ls -l /usr/local/bin/node_exporter
curl -s localhost:9100/metrics | head -5
Configure the Proxmox API Token
The Proxmox VE Exporter needs API access to pull cluster stats. You have to do this in the right order through the Proxmox web UI, otherwise the permissions dropdown will be totally blank.
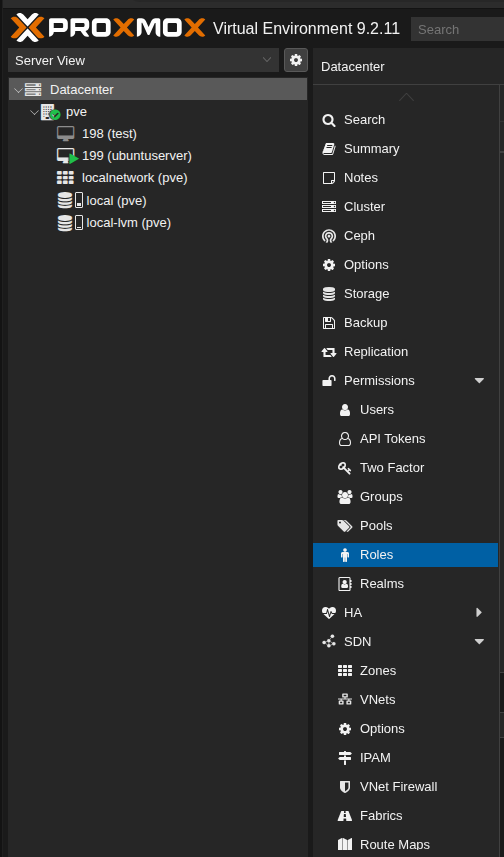
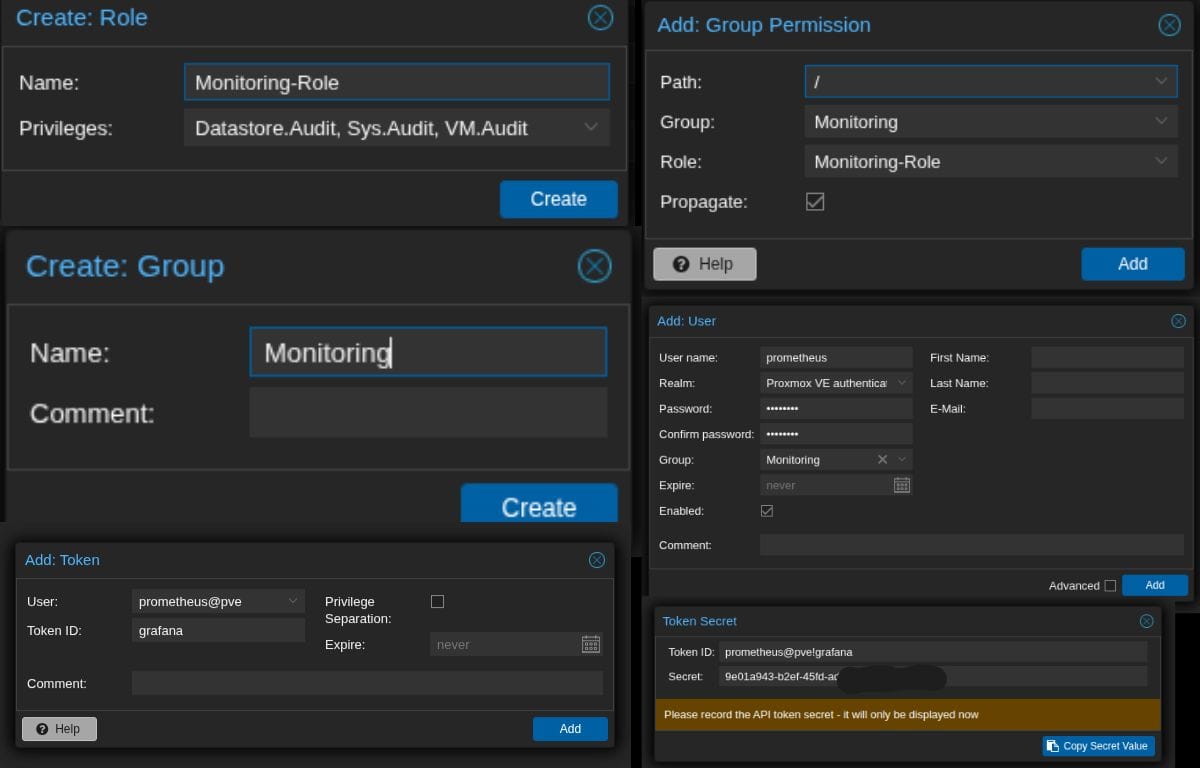
Role: On the Proxmox web UI, find Datacenter and click on it. Then go to Permissions > Roles > Create. Name it Monitoring-Role. You won't see a PVEAuditor checkbox — just manually check three items: Sys.Audit, VM.Audit, and Datastore.Audit.
Group: We need to create a group. In Datacenter, find Permissions, then find Groups under Permissions, and create a group. Name this group Monitoring.
Group Permission: For the group permission, in Datacenter, go to Permissions, then Add, and select Group Permission. Set Path to /, Group to Monitoring, Role to Monitoring-Role, and check Propagate.
User: Create a new user. In Datacenter, go to Permissions, Users, then Add. Name it prometheus, set Realm to Proxmox VE authentication server (pve), and set Group to Monitoring. Enter any password. Skip adding a separate User Permission.
Token: Final step — go to Datacenter, Permissions, API Tokens, then Add. Set User to prometheus@pve and Token ID to grafana. Make sure to uncheck Privilege Separation. If you leave it checked, the token gets zero permissions and throws a 403 error. A new dialog will open — copy the Secret and paste it somewhere safe, as it will be required later.
All of the above setup is shown in one image.
Back on the Ubuntu VM: Config files
Now switch to Ubuntu. Let's set up the Docker directories. We will create three config files in this section.
mkdir -p ~/monitoring/{prometheus,pve-exporter}
cd ~/monitoring
pve-exporter/pve.yml
Create the exporter config file. This is where your API token goes. This config file requires the username, token name, and secret key.
nano pve-exporter/pve.yml
In this file, paste the code below, but replace PASTE_YOUR_SECRET_HERE with your secret.
default:
    user: prometheus@pve
    token_name: grafana
    token_value: PASTE_YOUR_SECRET_HERE
    verify_ssl: false
Then save the file using CTRL+O, Enter, then CTRL+X.
prometheus/prometheus.yml
This file requires your Proxmox IP.
nano prometheus/prometheus.yml
In this file, there are TWO places where PROXMOX_HOST_IP is written — replace both with your Proxmox IP (e.g., 192.168.100.200). Do not change pve-exporter at the end of the file.
global:
  scrape_interval: 15s

scrape_configs:
  - job_name: 'prometheus'
    static_configs:
      - targets: ['localhost:9090']

  - job_name: 'proxmox-host'
    static_configs:
      - targets: ['PROXMOX_HOST_IP:9100']

  - job_name: 'proxmox-api'
    metrics_path: /pve
    scrape_timeout: 30s
    scrape_interval: 60s
    static_configs:
      - targets:
        - PROXMOX_HOST_IP
    relabel_configs:
      - source_labels: [__address__]
        target_label: __param_target
      - source_labels: [__param_target]
        target_label: instance
      - target_label: __address__
        replacement: pve-exporter:9221
Then save the file.
docker-compose.yml
Make sure the volume mount for pve.yml points exactly to /etc/prometheus/pve.yml. If you mount it to /etc/pve.yml, the container will crash-loop with a FileNotFoundError.
nano docker-compose.yml
Paste this into your compose file.
services:
  prometheus:
    image: prom/prometheus:latest
    container_name: prometheus
    volumes:
      - ./prometheus/prometheus.yml:/etc/prometheus/prometheus.yml
      - prom_data:/prometheus
    ports:
      - "9090:9090"
    restart: unless-stopped

  grafana:
    image: grafana/grafana:latest
    container_name: grafana
    volumes:
      - grafana_data:/var/lib/grafana
    ports:
      - "3000:3000"
    restart: unless-stopped

  pve-exporter:
    image: prompve/prometheus-pve-exporter
    container_name: pve-exporter
    volumes:
      - ./pve-exporter/pve.yml:/etc/prometheus/pve.yml
    ports:
      - "9221:9221"
    restart: unless-stopped

volumes:
  prom_data:
  grafana_data:
Then save the file.
Fire it up and test
Start the stack.
cd ~/monitoring
sudo docker compose up -d
sudo docker ps
After running the above commands, wait around 10 seconds, then test the exporter directly. Check this before you look at Grafana, so you know if your authentication is actually working.
curl "http://localhost:9221/pve?target=PROXMOX_HOST_IP" | head -20
Expected Output:
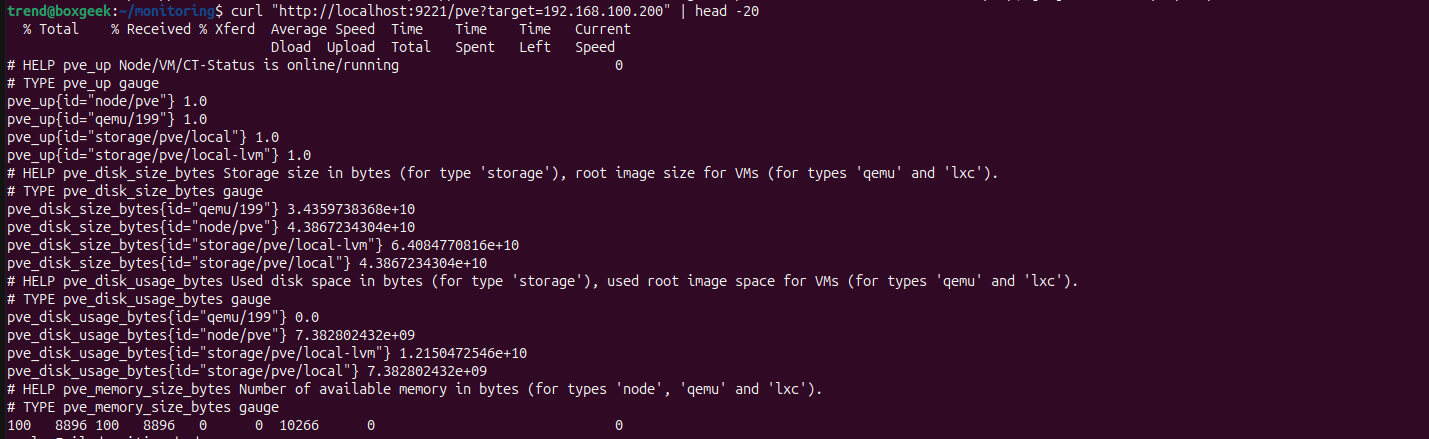
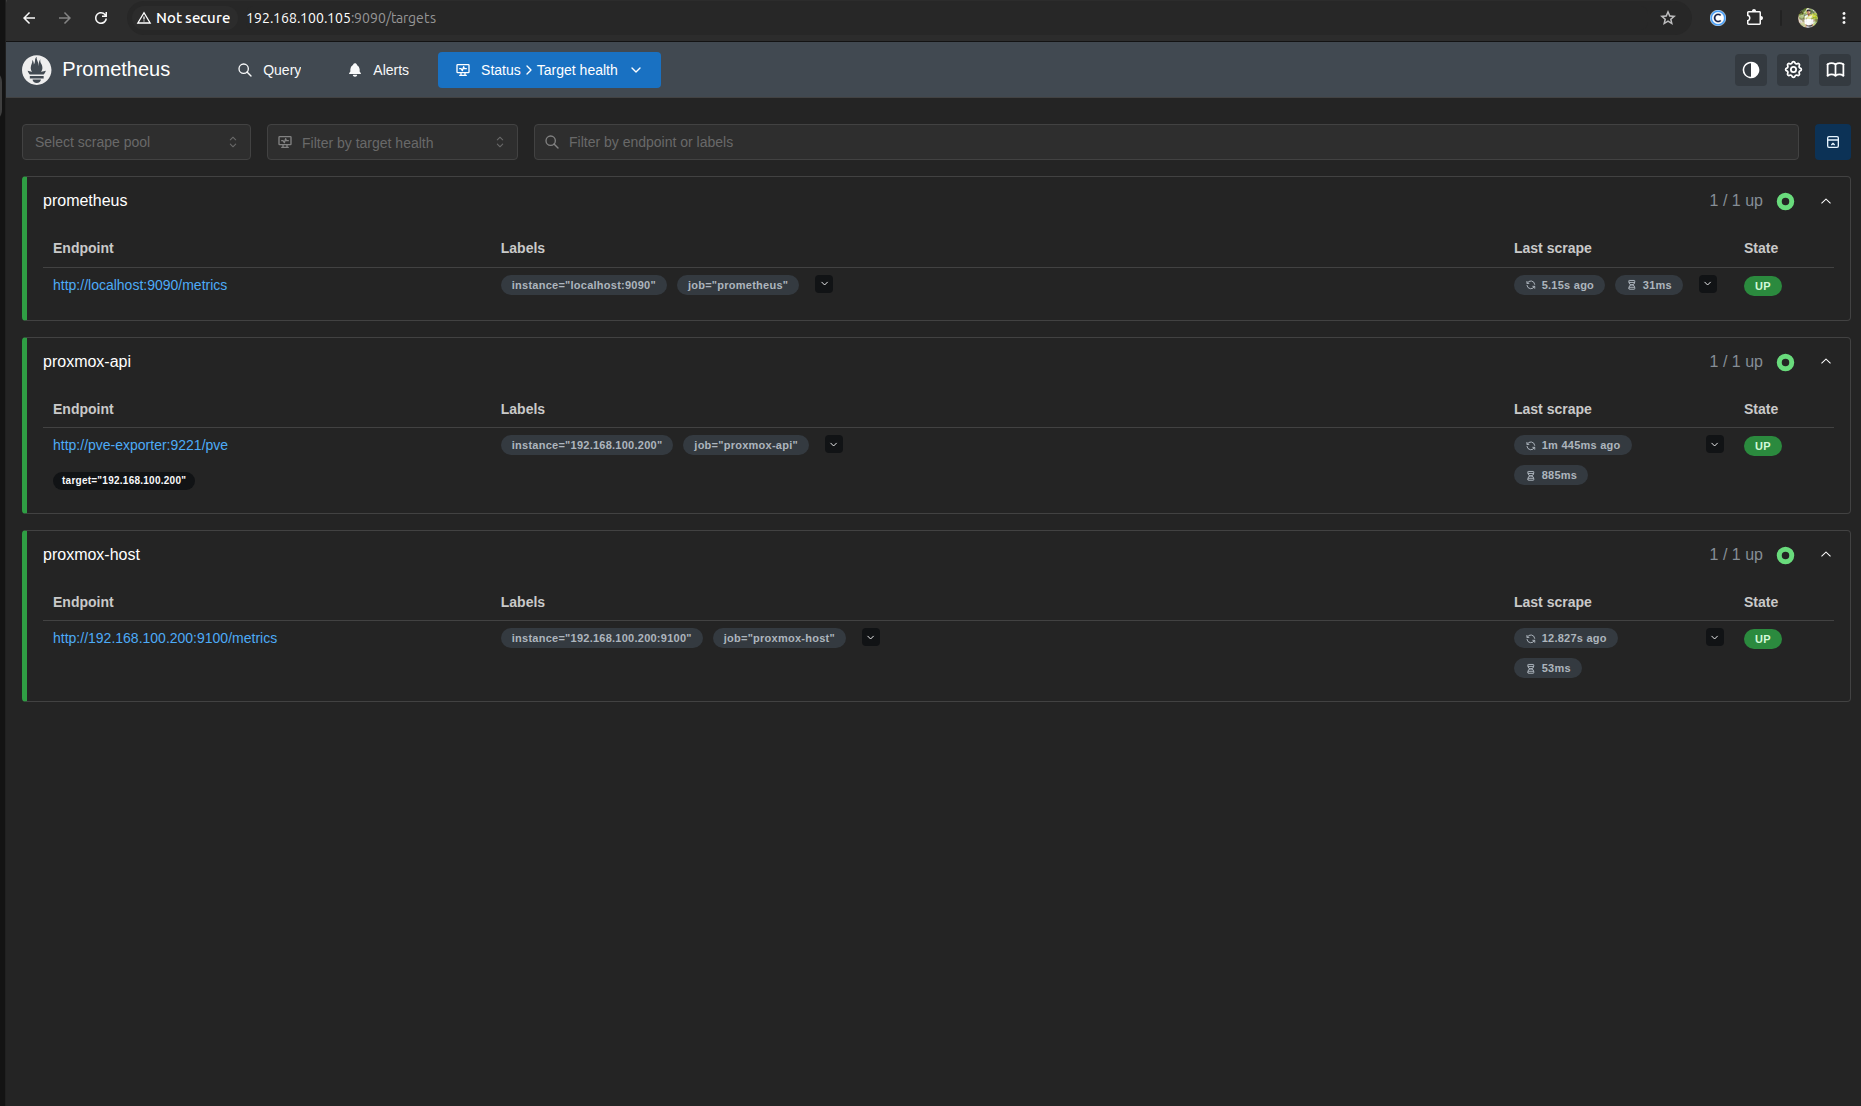
Once the output looks like the screenshot, open your browser and go to http://VM_IP:9090. Replace VM_IP with your Ubuntu 26.04 IP. On the homepage, first go to Status > Target health. Make sure all three targets are UP and showing a green light. If they are not up, wait a minute.
Configure Grafana
Now open Grafana at http://VM_IP:3000 and log in with the username and password admin / admin. After logging in, you can change the password.
Then go to Connections, then Data Sources, and click Add data source, then select Prometheus. In the setup, add the URL http://prometheus:9090. Then click Save & Test.
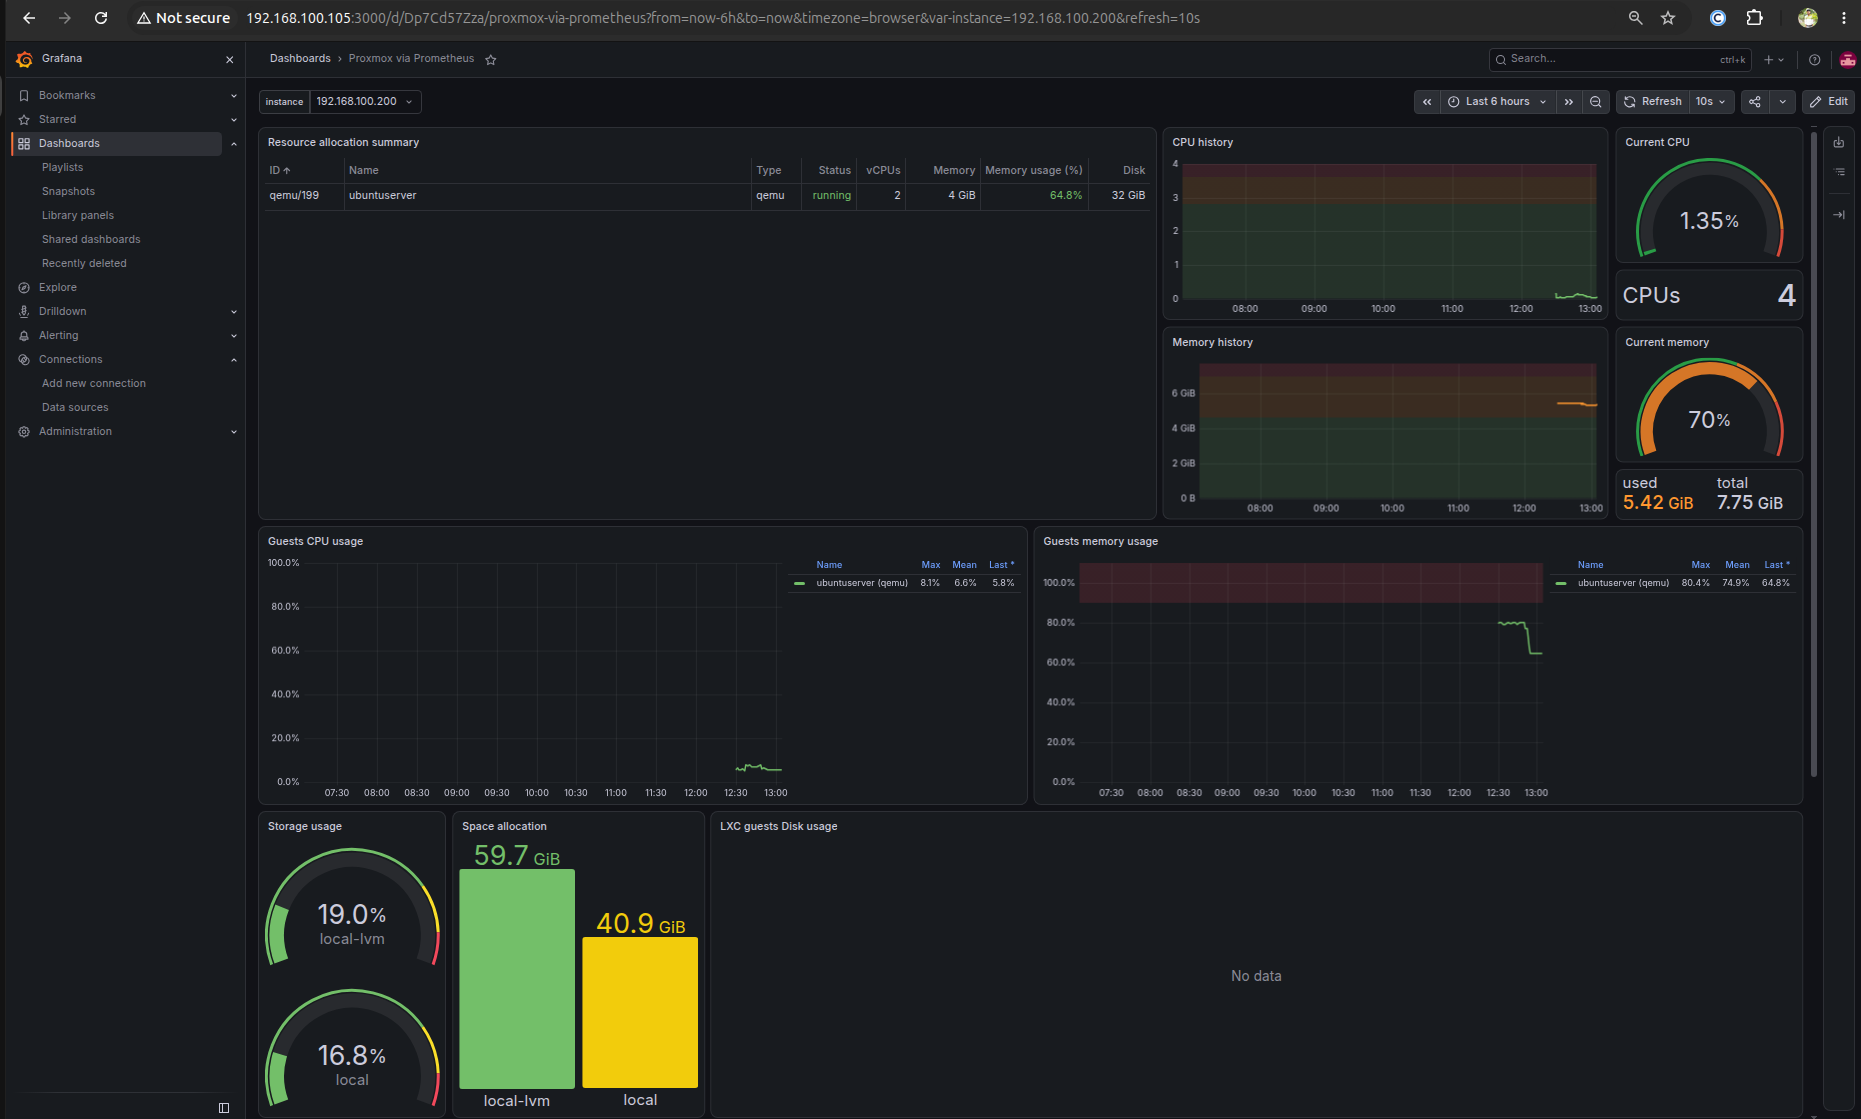
Next, go to Dashboards and click Import in the top right. Enter ID 10347 for the Proxmox cluster view, and 17306 for the Node Exporter host stats. Your Grafana will then look like the image below.
What's Next
That's it. You now have a solid monitoring stack that does not mess with your hypervisor. By keeping Prometheus and Grafana containerized on a dedicated VM, you can break it, back it up, or move it without putting your Proxmox host at risk. It gives you great dashboards to explore interesting data. Once you have a baseline, you can start building custom Grafana alerts to notify you.
